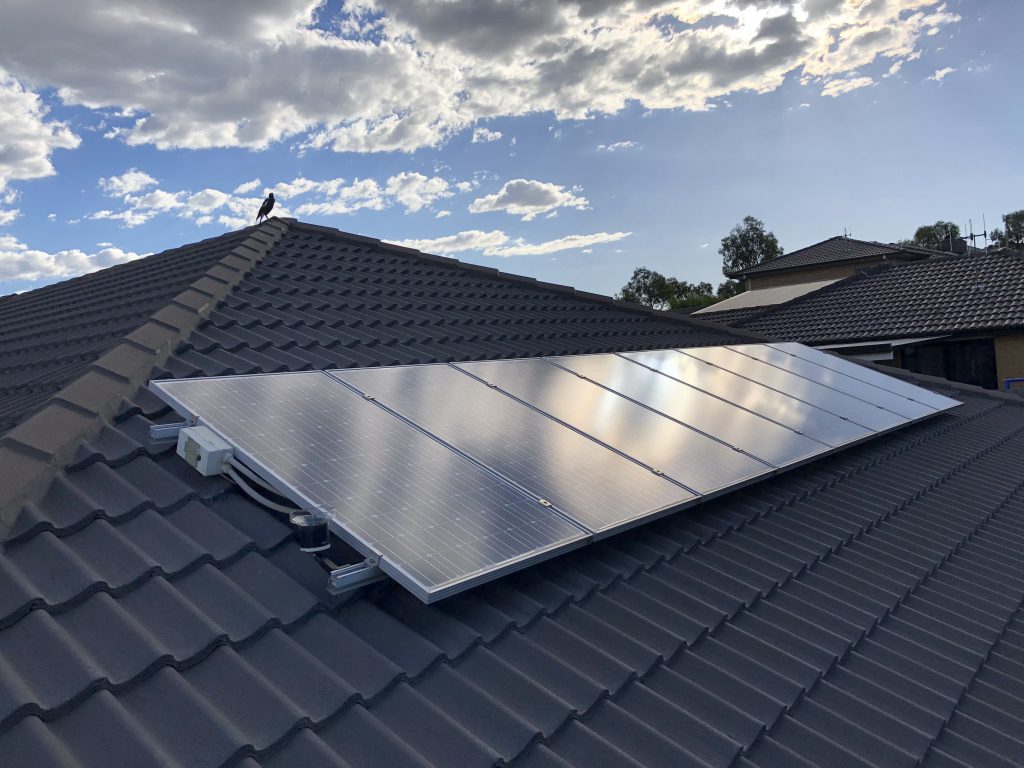
8 x Suntech Power STP190S-24/Ad+ 190w solar panels
The efergy engage online portal is, for a lack of a better word, spartan. It doesn’t look to have been updated since 2014, and is focused on basic power usage stats. For anyone generating electricity via a solar setup, the features are terribly lacking (no feed-in tariff cost reports, no configurable offset schemes, no weather correlation, etc).
If you would like to take advantage of more advanced options, like sliding tariffs for consumption and temperature and weather considerations for solar generation, you may want to push your efergy engage data (via their API) to pvoutput.org
Why would you bother pushing electricity consumption data to pvoutput.org?
You can set granular usage tariffs for peak, offpeak, shoulder and high-shoulder timeframes, and also daily service/connection fees. This allows you to have a precise calculation of your expected billing. This is not possible in the basic ‘efergy engage’ power usage dashboard.
Applicable to both consumption and generation, you can individually ‘trim’ your power readings to align them with your electricity meter readings. For instance, your usage may be read as 300W on the efergy engage c-clamps, but your electricity meter may be registering 330W. It makes a lot of sense to align the readings with what you are being billed for. With pvoutput.org you can set a rule such as: if(in) *=1.10 to increase the registered reading for all usage by 10%. Seperate rules can be created for electricity generation (using ‘out’ as the operator) or for both directions (‘all’).
Why bother pushing solar electricity generation data to pvoutput.org?
Spoiler alert. This is where the pvoutput.org site really shines. As the site domain name suggests (photo voltaic output), pvoutput.org is a site geared towards solar electricity generators.
You can set the exact parameters of your solar setup, including but not limited to: number of panels, wattage of each panel, solar size in watts, the age of the system, the pitch of the panels, the azimuth (offset in angle from due north in Australia), any shading (and the times of the day that shading occurs), local weather (including personal weather stations on wunderground.com) and the age of the system. These parameters then combine to give you a calculated ‘insolation’ figure and percentage (an expected generation amount). If the insolation figure is much higher than your solar setup can generate in a day, then perhaps there is a fault with your setup that needs to be rectified. If you are consistently within 80% of the insolation figure, then your panels are producing electricity as expected.
Alerts can be created, warning you via e-mail if generation drops below a configurable threshold at any time during the day.
Solar generation is rewarded differently all over the world. Feed-in tariffs are varied, and calculated in net (paid for your generation minus your consumption) or gross (paid for all of your generation) terms. pvoutput.org allows the configuration of every conceivable variation for a solar setup, including split-systems with multiple panel and inverter groups.
So what does the live-output page look like?
I’ll use my own public live-output page as an example. Every 5 minutes, the pvoutput.org account makes a call to my efergy engage power monitor (via API), and polls the solar generation power figure (in Watts). At the same time, pvoutput.org makes a call to my wunderground.com personal weather station to record a temperature for that point in time. The temperature recording is important for calculating generation losses, as my Suntech Power STP190S-24/Ad+ monocrystaline solar panels are rated to lose 0.45% of efficiency for every degree over 25 celsius.
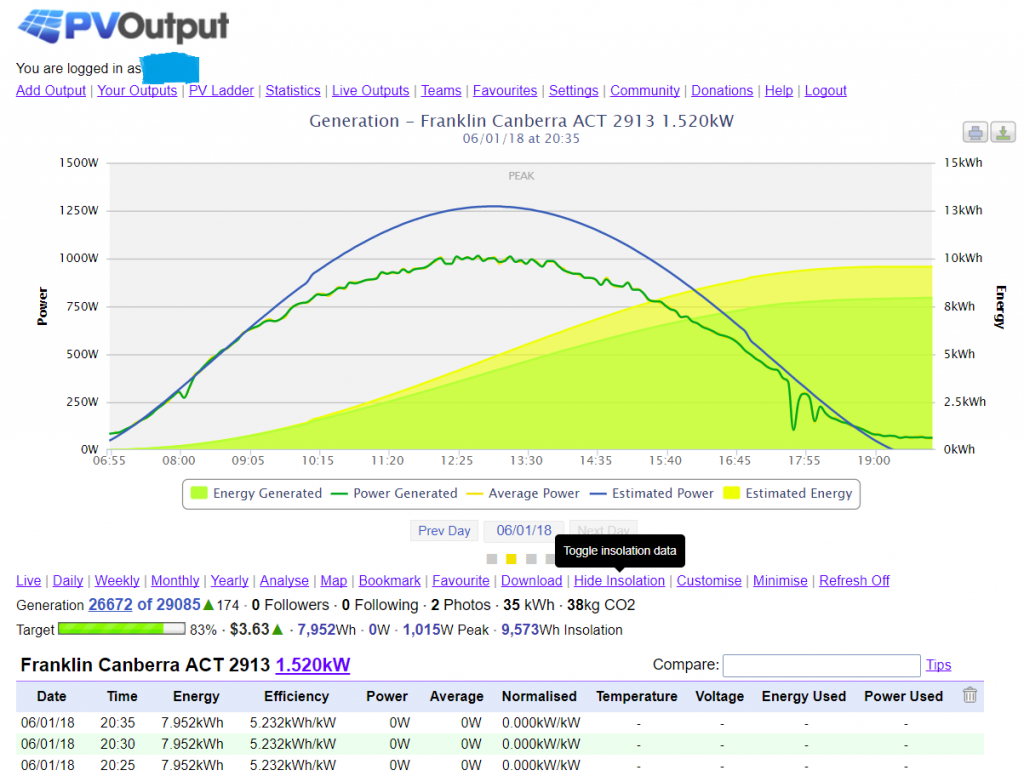
By calling/polling my live power output, pvoutput.org creates a detailed report for the day. The image above shows my point-in-time generation (green line), the expected generation (the insolation figure – blue line), the cumulative energy generated for the day (green filled) and expected energy generation (yellow filled).
Using my configured tariff data, a detailed total of $ earned per day is reported. The total generated Wh, Peak W and Wh insolation figures are also shown.
PV enthusiasts can also use pvoutput.org socially, ‘following’ other contributors, sharing pictures of setups and for messaging. The community consists of the smallest home generators (me) and the biggest enterprise solar farms in the world. A ‘generation ladder’ allows you to compare your own solar setup with over 29,000 other systems (at the time of writing this post).
Your generation and usage can be kept private, secured via a login page, or shared with the community. I am sharing my generation, but not my usage. Call me paranoid, but someone could easily work out whether I’m home or not based on the household electricity usage.
pvoutput.org is truly brilliant for electricity usage and generation reporting. Try it! You can find my public pvoutout.org page here.
1 thought on “pvoutput.org – live power monitoring with efergy engage”