I’ve always wondered how much energy my solar panels are producing at any given time. Occasionally, I’ll look at the tiny LCD read-out on my SMA Sunny Boy SM1700 solar inverter, and wait for the PAC (power actual in watts) and daily outputs to show on the scrolling menu.
Same applies to reading my current household power usage. The only way I’ve been able to do this is to check my power meter.
Historical trend analysis, and understanding baseline usage has also been near on impossible (my power bills show quarterly – 3 month usage and solar production). The bills are not granular, and don’t show exactly what happens throughout the billing cycle, let alone real-time.
A friend at work had just found out about the efergy engage product, and we ended up ordering our kits at the same time.
The efergy engage wireless power meter has allowed me to monitor my solar production and total household electricity usage in real-time (the polling interval is 6 seconds).
Pre-purchase research
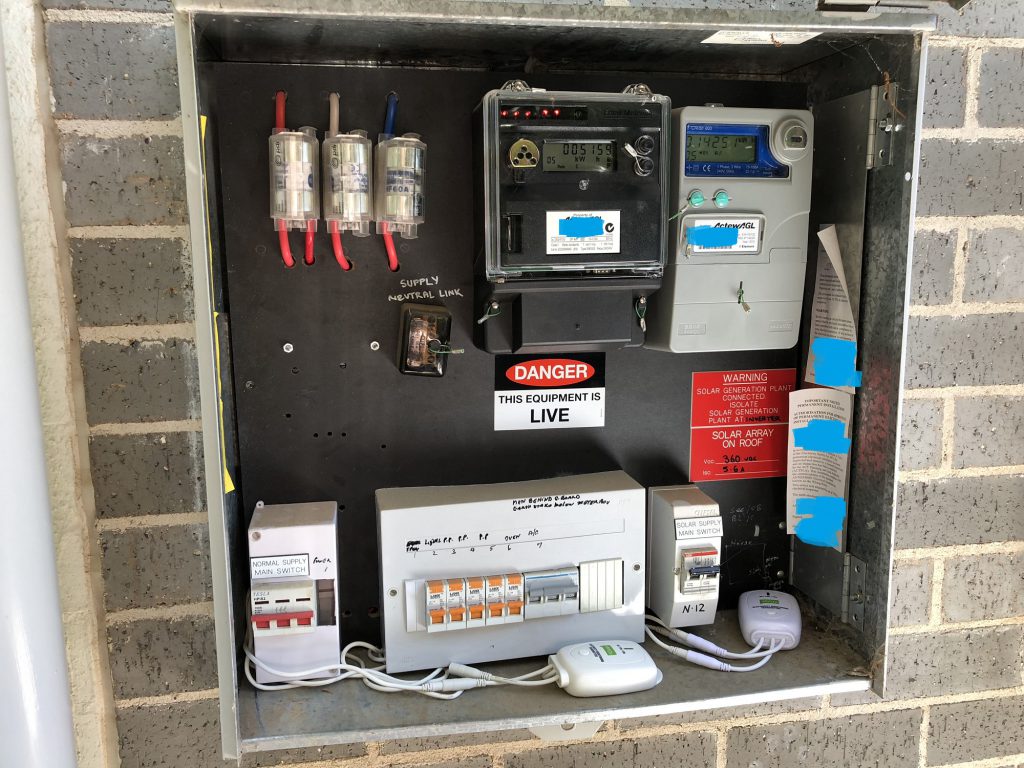
Before ordering the efergy engage wireless power monitor, I needed to understand how many phases of electricity my house is configured for both supply and solar generation. This was easily discovered by opening the meter box and gathering the data from the meters.
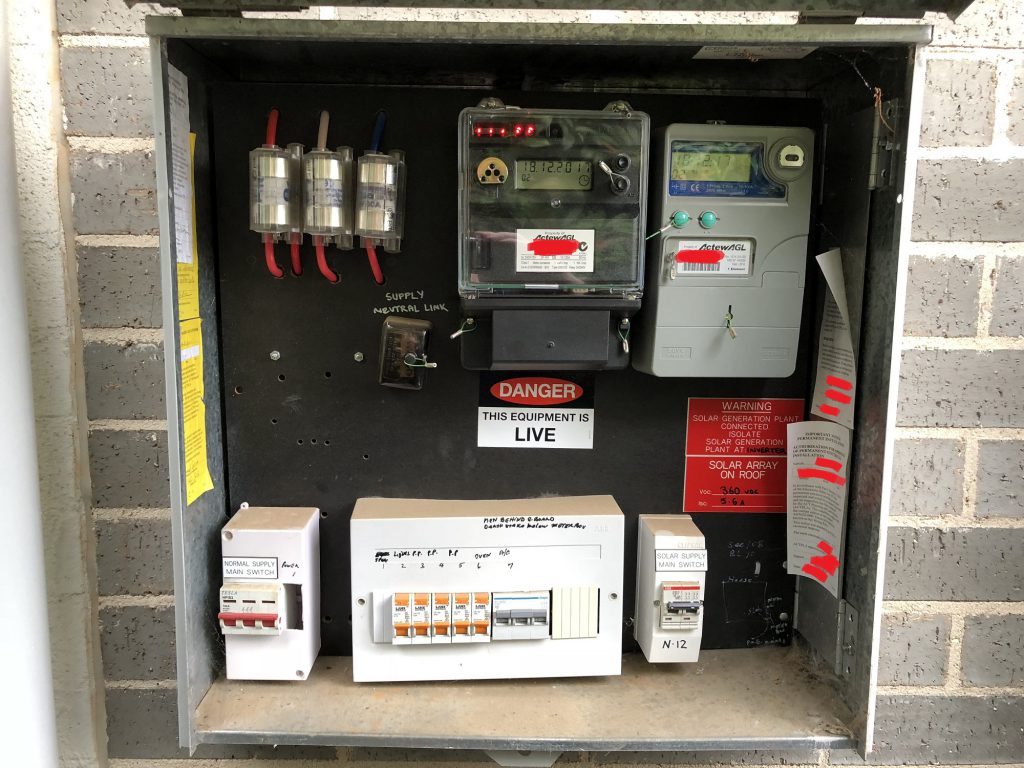
The 3 large fuses visible to the top left of the image above shows that the supply to my house is 3 phase. This is further confirmed by reading the fine text on the meters themselves.
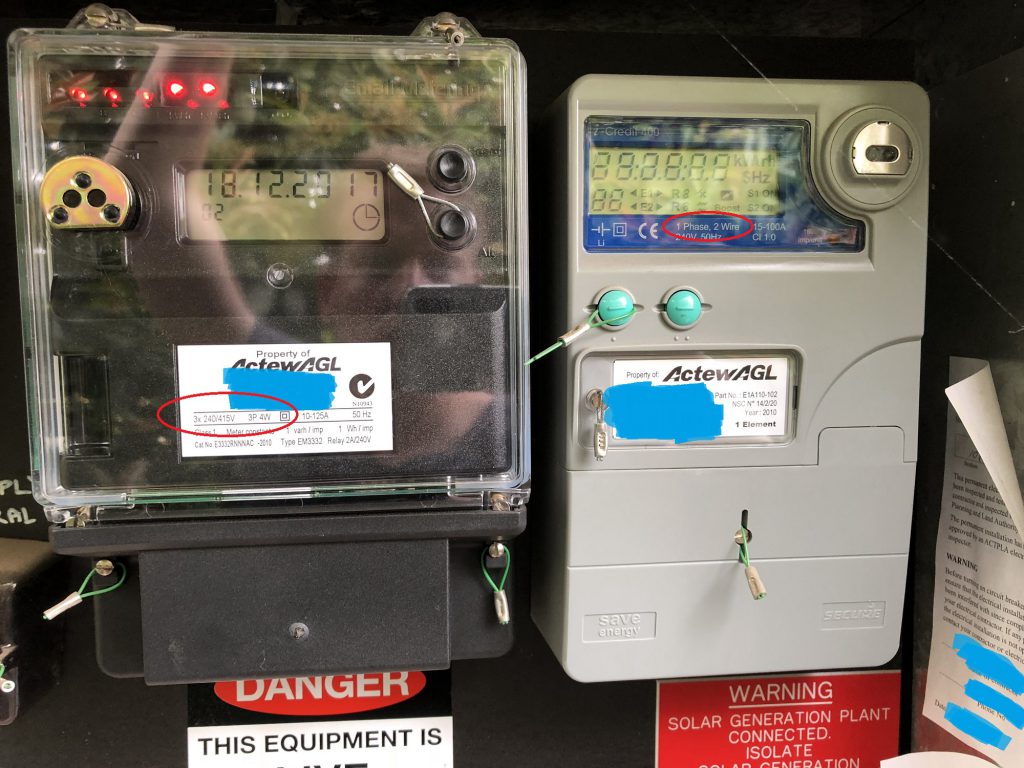
The meters clearly show a 3 phase consumption supply, and a 1 phase solar production output.
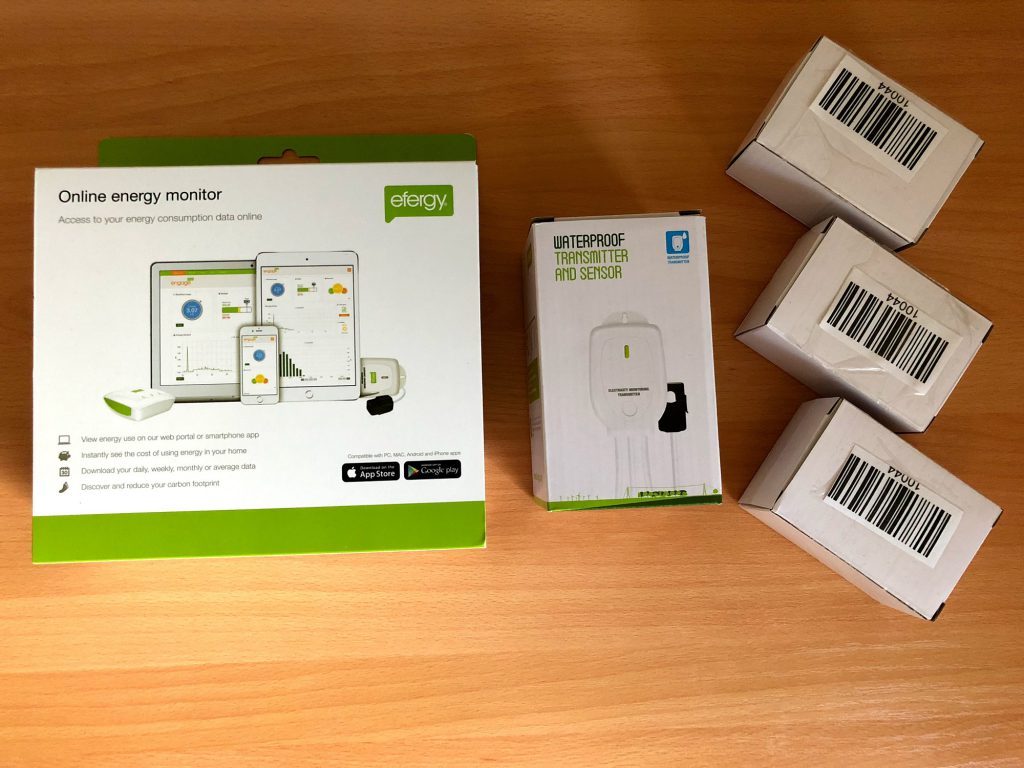
Based on my electrical setup, I knew I would have to order:
- efergy engage basic kit (1 receiver, 1 transmitter, 1 c-clamp)
- 1 additional transmitter (for solar metering)
- 3 additional c-clamps (to bring the total to 4; 3 for 3 phase consumption, 1 for 1 phase solar production)
I ended up ordering my efergy engage kit from www.reductionrevolution.com.au They were extremely helpful, and even confirmed my efergy engage component needs based on pictures of my power meter box.
The kit came exceptionally well packaged, and within 2 days of placing the online order.
Setup (indoors)
The initial setup process was very easy. The first step is to register for an account on the efergy engage portal.
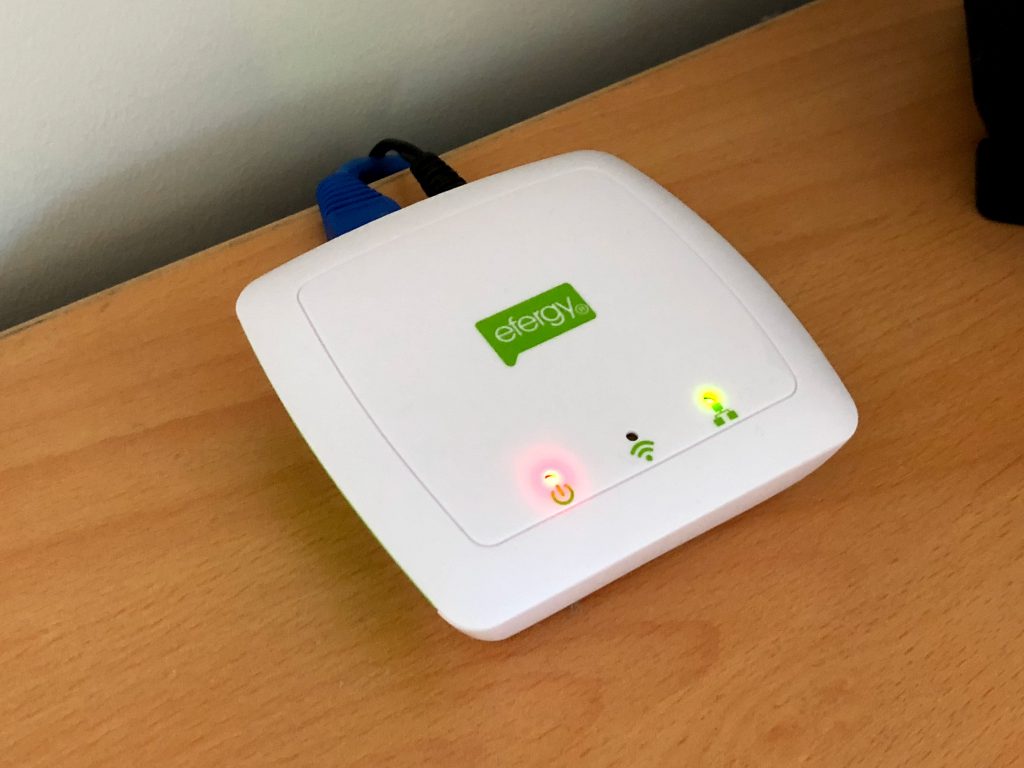
Next the hub needs to be plugged into your network via CAT5 cable, and powered on. It is a compact unit (of about 7cm x 7cm). It only transmits on the LAN when it needs to (every 6 seconds – just after receiving an update from both transmitters).
Next, while logged into the portal, within the ‘settings’ section of the portal, ‘scan for devices’. The hub should be detected (and if it is not detected automatically, it can be added via the MAC address – sticker on the hub). Each transmitter requires 3 AA batteries. The transmitter that came with the hub should be pre-paired with the hub, and can be named within the settings section of the efergy engage portal.
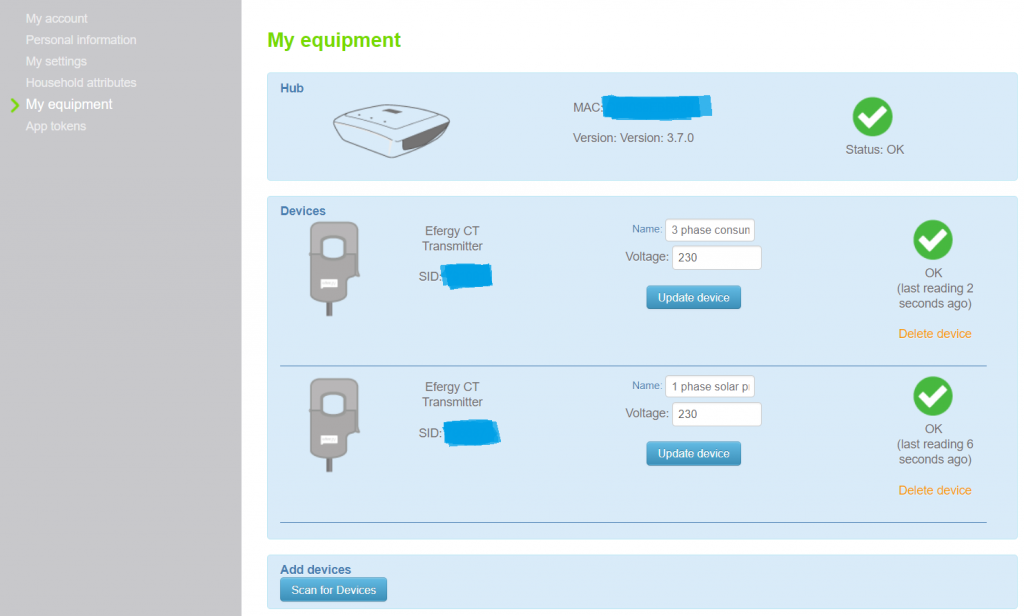
If you have purchased multiple transmitters, the pairing button can be pressed just before clicking ‘scan for devices’ in the portal. Once detected, the transmitter can be named. Here is my efergy engage portal hardware setup. In Australia we run 230V.
Setup (meter box)
Now that all of the components are paired and registered with the efergy engage portal, the transmitters and c-clamps need to be attached to your power meter/s. In Australia, the majority of meter boxes can be opened like a cupboard. It is always a good idea to engage (see what I did there?) the services of a qualified electrician if you are not 100% certain of your electrical setup.
In my case, the c-clamps are clipped around the 3 phases of usage, and 1 phase or solar production.
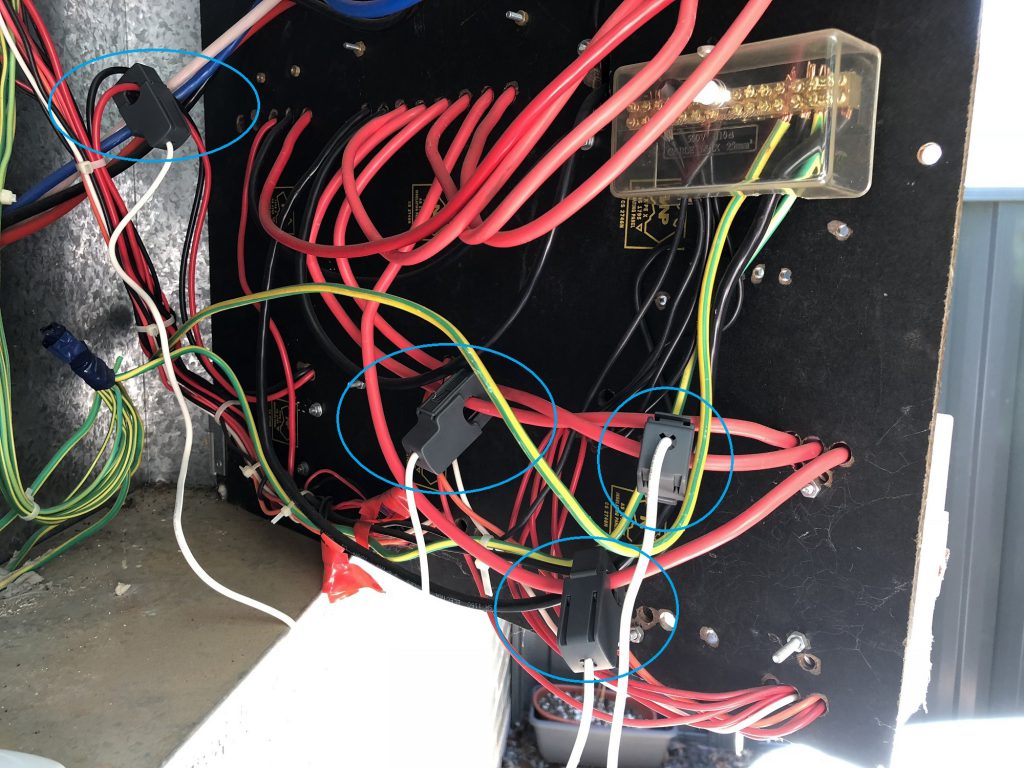
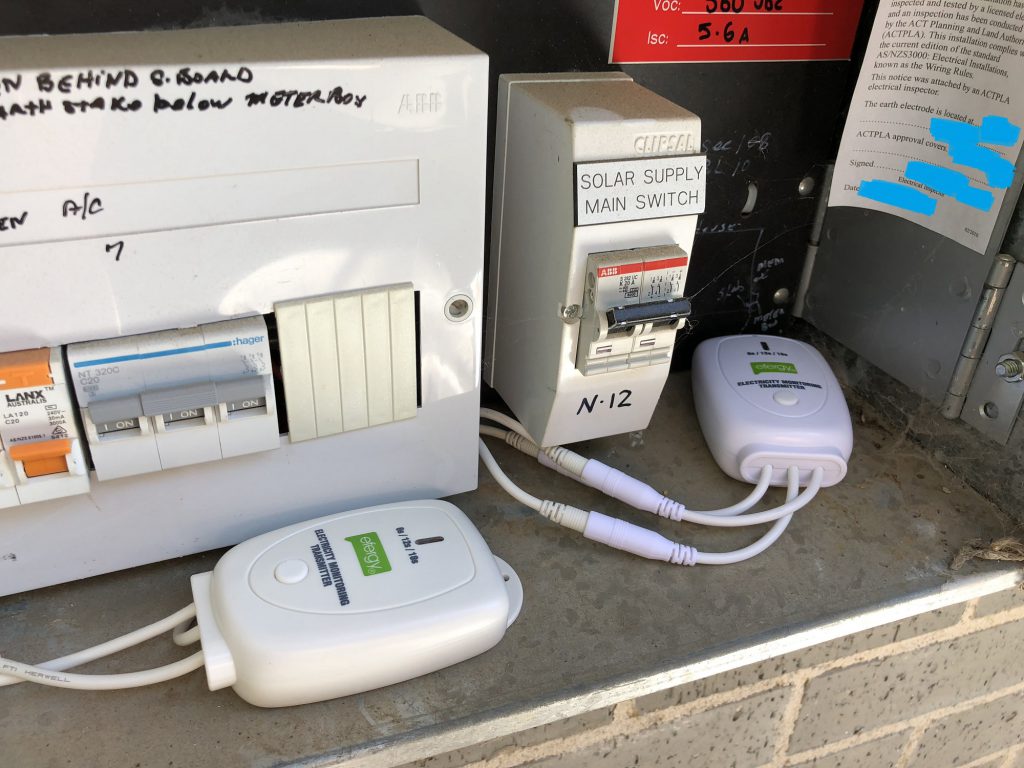
Once the c-clamps are attached, and the panel closed, the setup is very unobtrusive. The two transmitters don’t add too much mess to the meter box.
Here is a close-up photo.
Usage
Now that all of the components have been plugged in, the hub is registered and powered on, live power data will be pushed into the efergy engage cloud.
The data can be accessed via the web portal, an iOS app, Android app or via the API.
Here is what the web portal dashboard looks like.
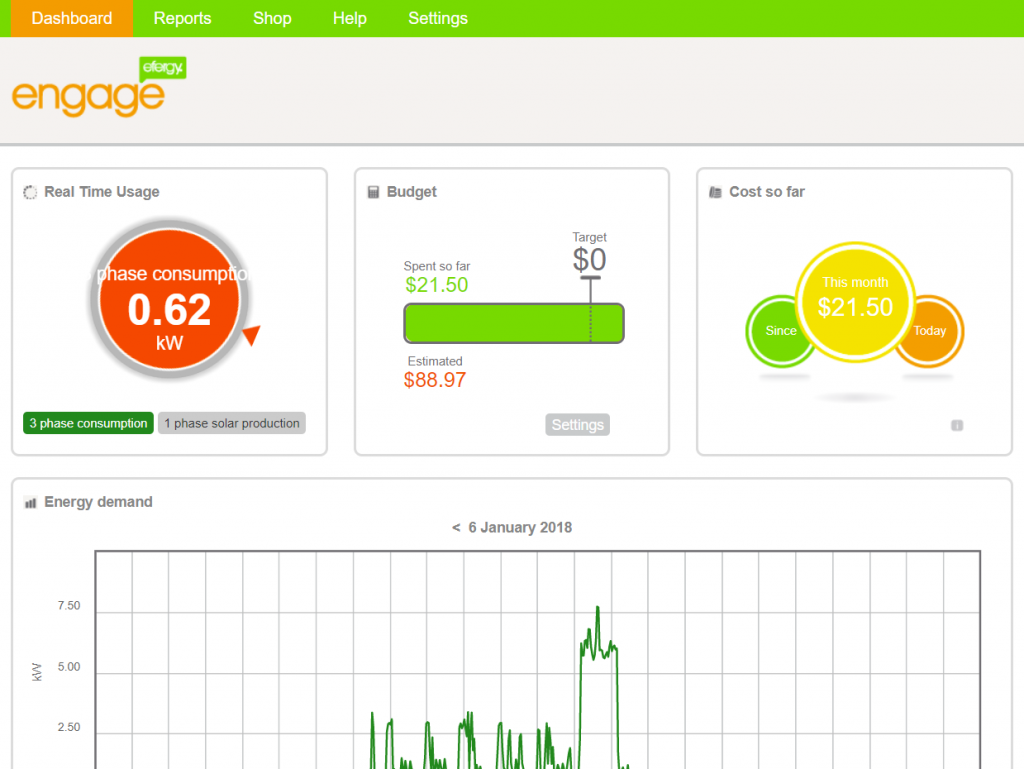
Real time usage (and production) is visible at the click of a mouse. Cost estimates and budgets can be set via tariff settings. Historical usage and analytics graphs are provided.
The mobile app is OK. Here is a screenshot.
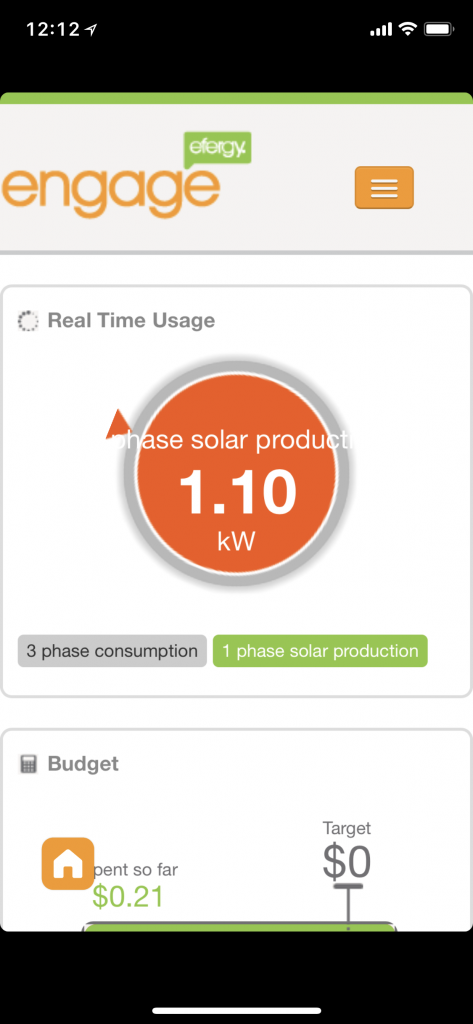
The app is certainly not iPhone X optimised, and a datestamp from back in 2014 appears while loading.
The efergy engage system does what it says it does on the box: it allows you to see your real-time usage (and production if applicable), and to see it historically.
But here are the negatives:
- the web-based dashboard is showing its age. It is a responsive web page, but the colours and layout seem a bit outdated.
- the iPhone and Android apps are most definitely showing their age, and seem to only redirect the request to the web-based dashboard, rather than being a bespoke app.
- only 1 usage tariff can be configured for power cost calculations. If you have off-peak, peak, shoulder and high-shoulder rates from your electricity provider, you cannot enter them all to get an accurate power cost calculation.
- no production tariffs can be configured, so if your solar production usually lowers your power costs (in a net or gross fashion) it will not be considered in the dashboard power cost calculations.
- there is no way to ‘trim’ out any metering variances. You cannot +10% your readings for instance, even if you wish to align the efergy engage c-clamp readings with your power meter stats.
Overall, the efergy engage system is fantastic at showing and logging real-time power usage and production. However, if you would like to analyse the data with more clarity, I would strongly recommend taking advantage of the API, and exporting your data to a system like pvoutput.org. I’ve written a blog post about exporting efergy engage data to pvoutput.org.
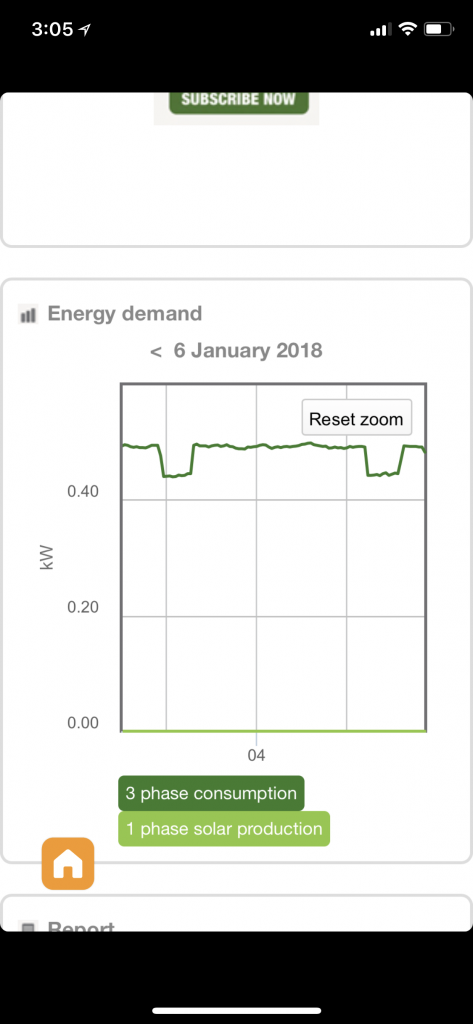
The accuracy is excellent. The efergy engage system clearly shows variances of 10W. If I plug in my phone to charge, usage goes up. My fridge shows a very clear on/off pattern on the daily trend-line. The image below shows a baseline usage of 410W which goes up to 430W when the fridge is running.
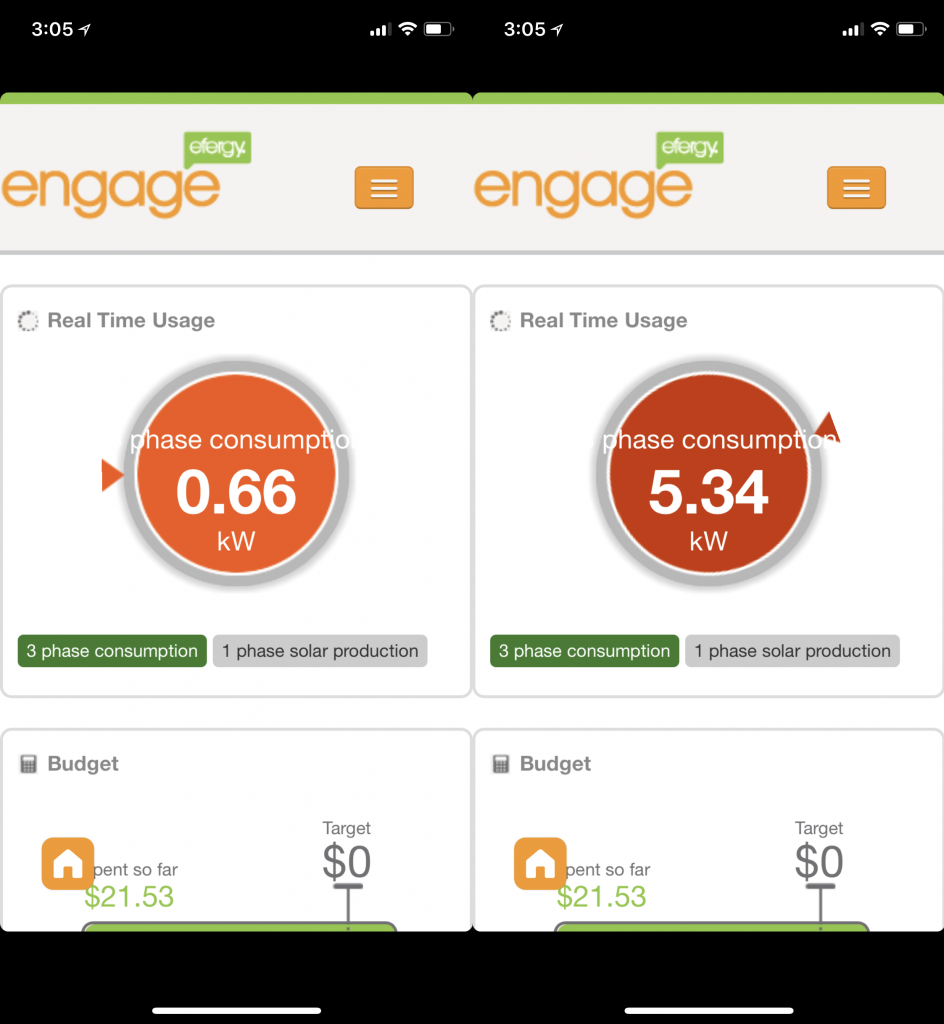
Subtle differences are obvious, and not-so-subtle changes are clear as daylight. Here is an image comparing daytime usage without air-conditioning, and with air-conditioning. As you can see, my air-conditioning system is a huge consumer of electricity when operational (however, it’s 36degrees celsius here in Canberra at the moment, so I can be forgiven for using it here and there).
The efergy engage system is a smart digital gateway to collecting and pushing electrical data to the cloud. If you like collecting, analysing and having access to real-time data, then this is a great system.
UPDATE: Just in-case you are wondering, the Efergy Engage batteries (3 AA batteries per transmitter) have lasted just over a year 06/01/2018 – 15/01/2019 before needing replacement.
Great insight into this product, thanks for taking the time to write it up.
I’m trying to decide between opting for the Efergy Engage, or more expensive (and rumoured to be more accurate) Smappee Energy. I’m leaning towards the Efergy due to it’s cost and battery operation (I’ll need to engage my sparky to install a GPO next to my meter for the Smappee).
If I can export the output to PVoutput I’ll be able to enter time of day rates and potentially use the trim you mention. One query here if you don’t mind: can I sign up to pvoutput if I *don’t* have solar?
Thanks!
Thanks for your comment. I appreciate the feedback.
While I can’t comment on the Smappee, I can say that the efergy engage has simply worked without fault since the installation date. The original batteries are still in both of my units.
pvoutput.org certainly does let you register and only upload consumption. Actually, a good trick is to search for some ‘live outputs’ called ‘consumption’ on the pvoutput.org site. There are a lot of public results like this one: https://pvoutput.org/intraday.jsp?id=58264&sid=52058
Cheers!